Error message
The submitted value field_published_date_value in the Sort by element is not allowed.
100
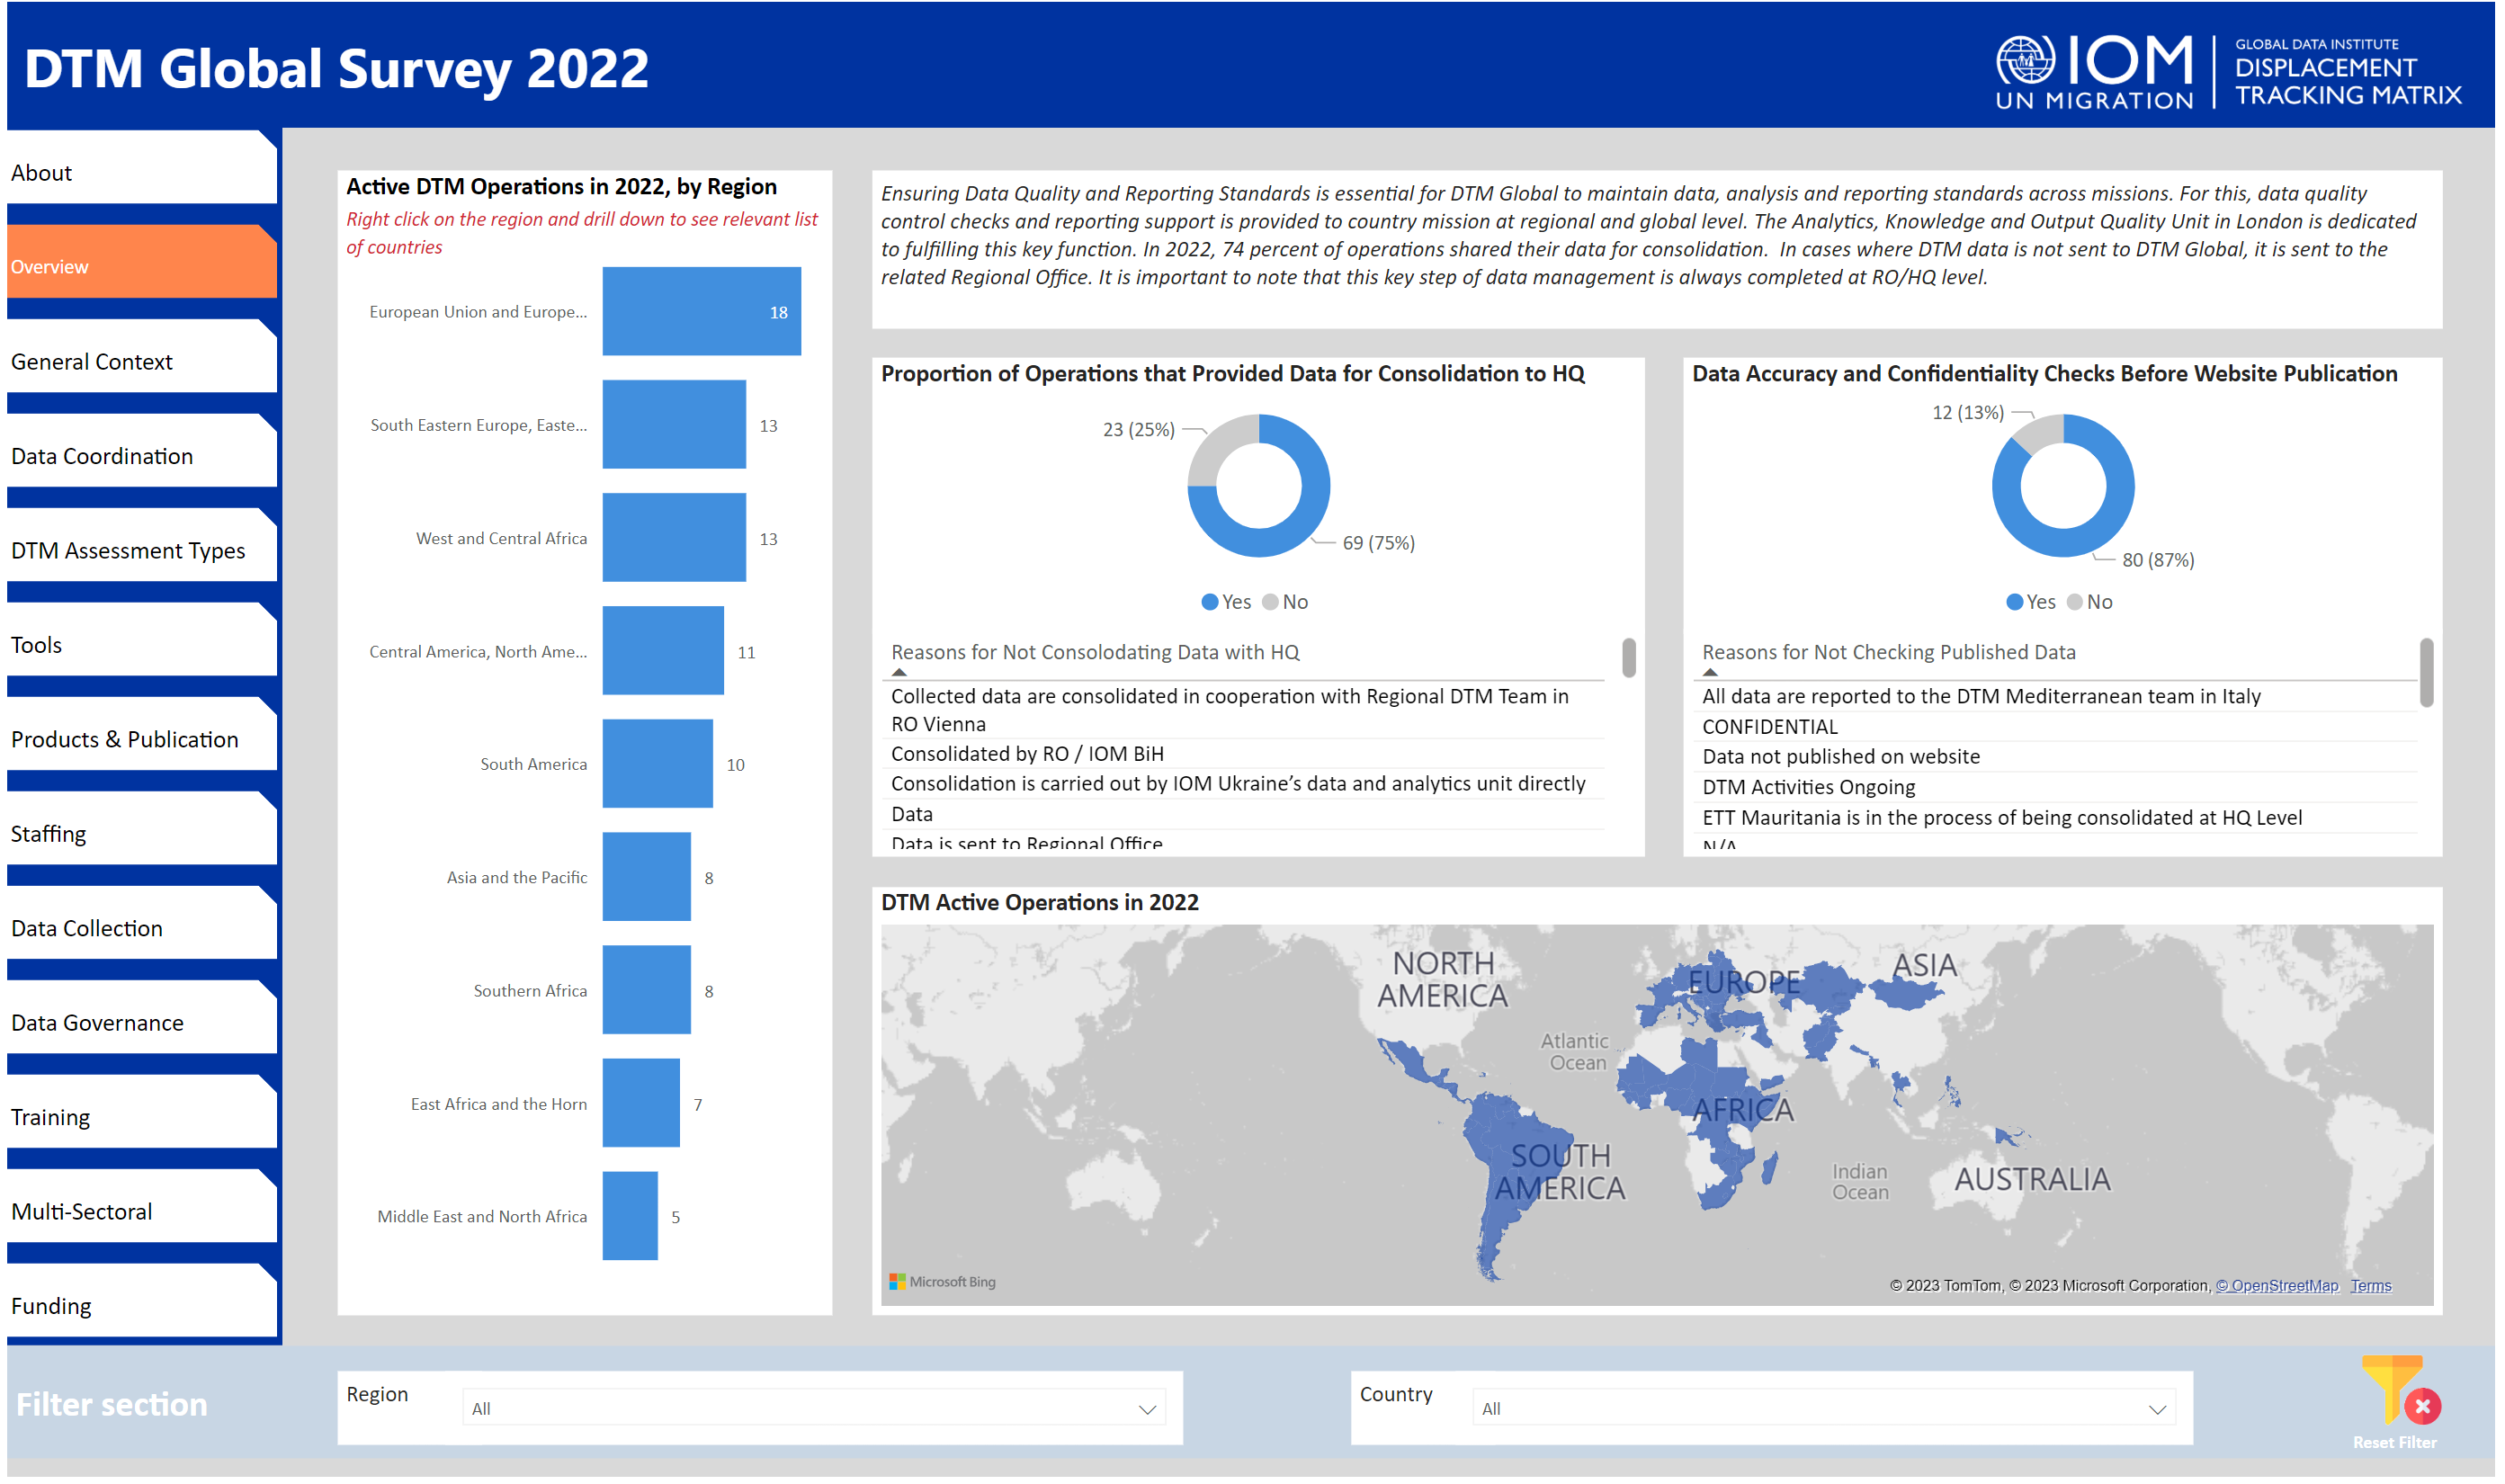
Active DTM Countries
3.6 K
Locations Assessed
2.3 K
Flow monitoring points
13 K
Reports
2 K
Datasets
113
Online Interactive Resources
What is the Displacement Tracking Matrix?
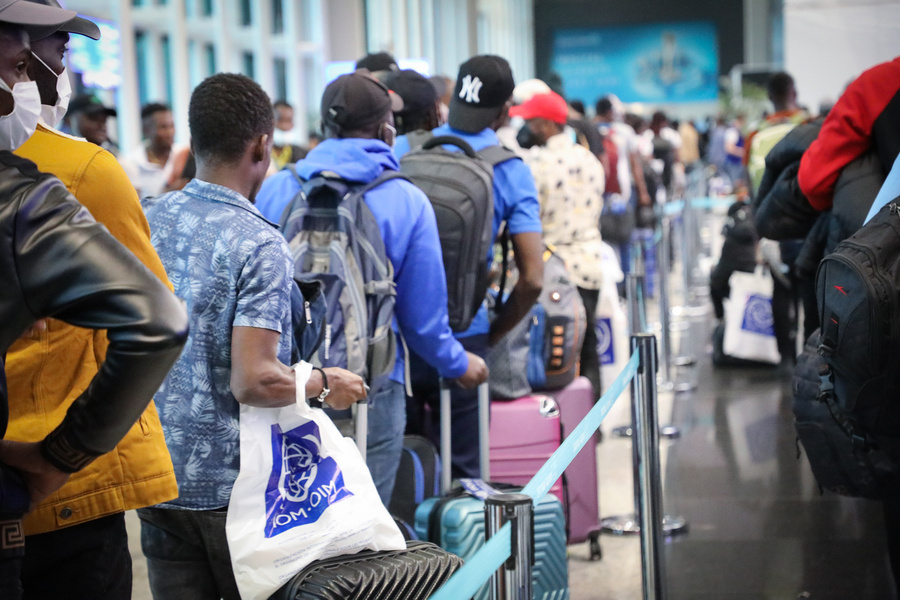
The Displacement Tracking Matrix (DTM) gathers and analyzes data to disseminate critical multi layered information on the mobility, vulnerabilities, and needs of displaced and mobile populations that enables decision makers and responders to provide these populations with better context specific assistance.
 Global Data Institute
Established in 2022, IOM's Global Data Institute (GDI) works to enhance the availability and use of data to achieve stronger governance outcomes and positive impacts for migrants and societies in line with IOM's Migration Data Strategy. DTM is one of the founding pillars of the GDI, alongside the Global Migration Data Analysis Centre (GMDAC).
Methodological Components of DTM
For a detailed explanation of DTM methodologies please refer to the Methodological Framework.
Mobility Tracking
Systematically collects data on locations, target populations and their diverse needs to inform assistance.
Group and location
Flow Monitoring
Tracks movement flows, profiles of movers and the overall situation at key points of origin, transit locations, and points of entry.
Individual, Group, and Location
Registration
Creates a record of individuals and households in a location for beneficiary selection, vulnerability targeting and humanitarian programming.
Household, Individual, and Location
Surveys
Gathers specific information using sampling from the population of interest
Household, Individual, Group, and Location
How does it all work?
Identifying Data Needs
Methodology Definition
Form/Application Design
Data Collection & Cleaning
Analysis & Reporting
Data & Report Dissemination
Operational Presence
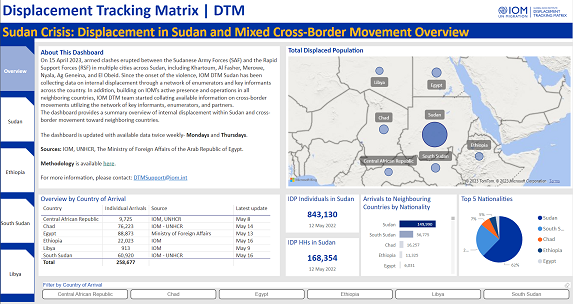
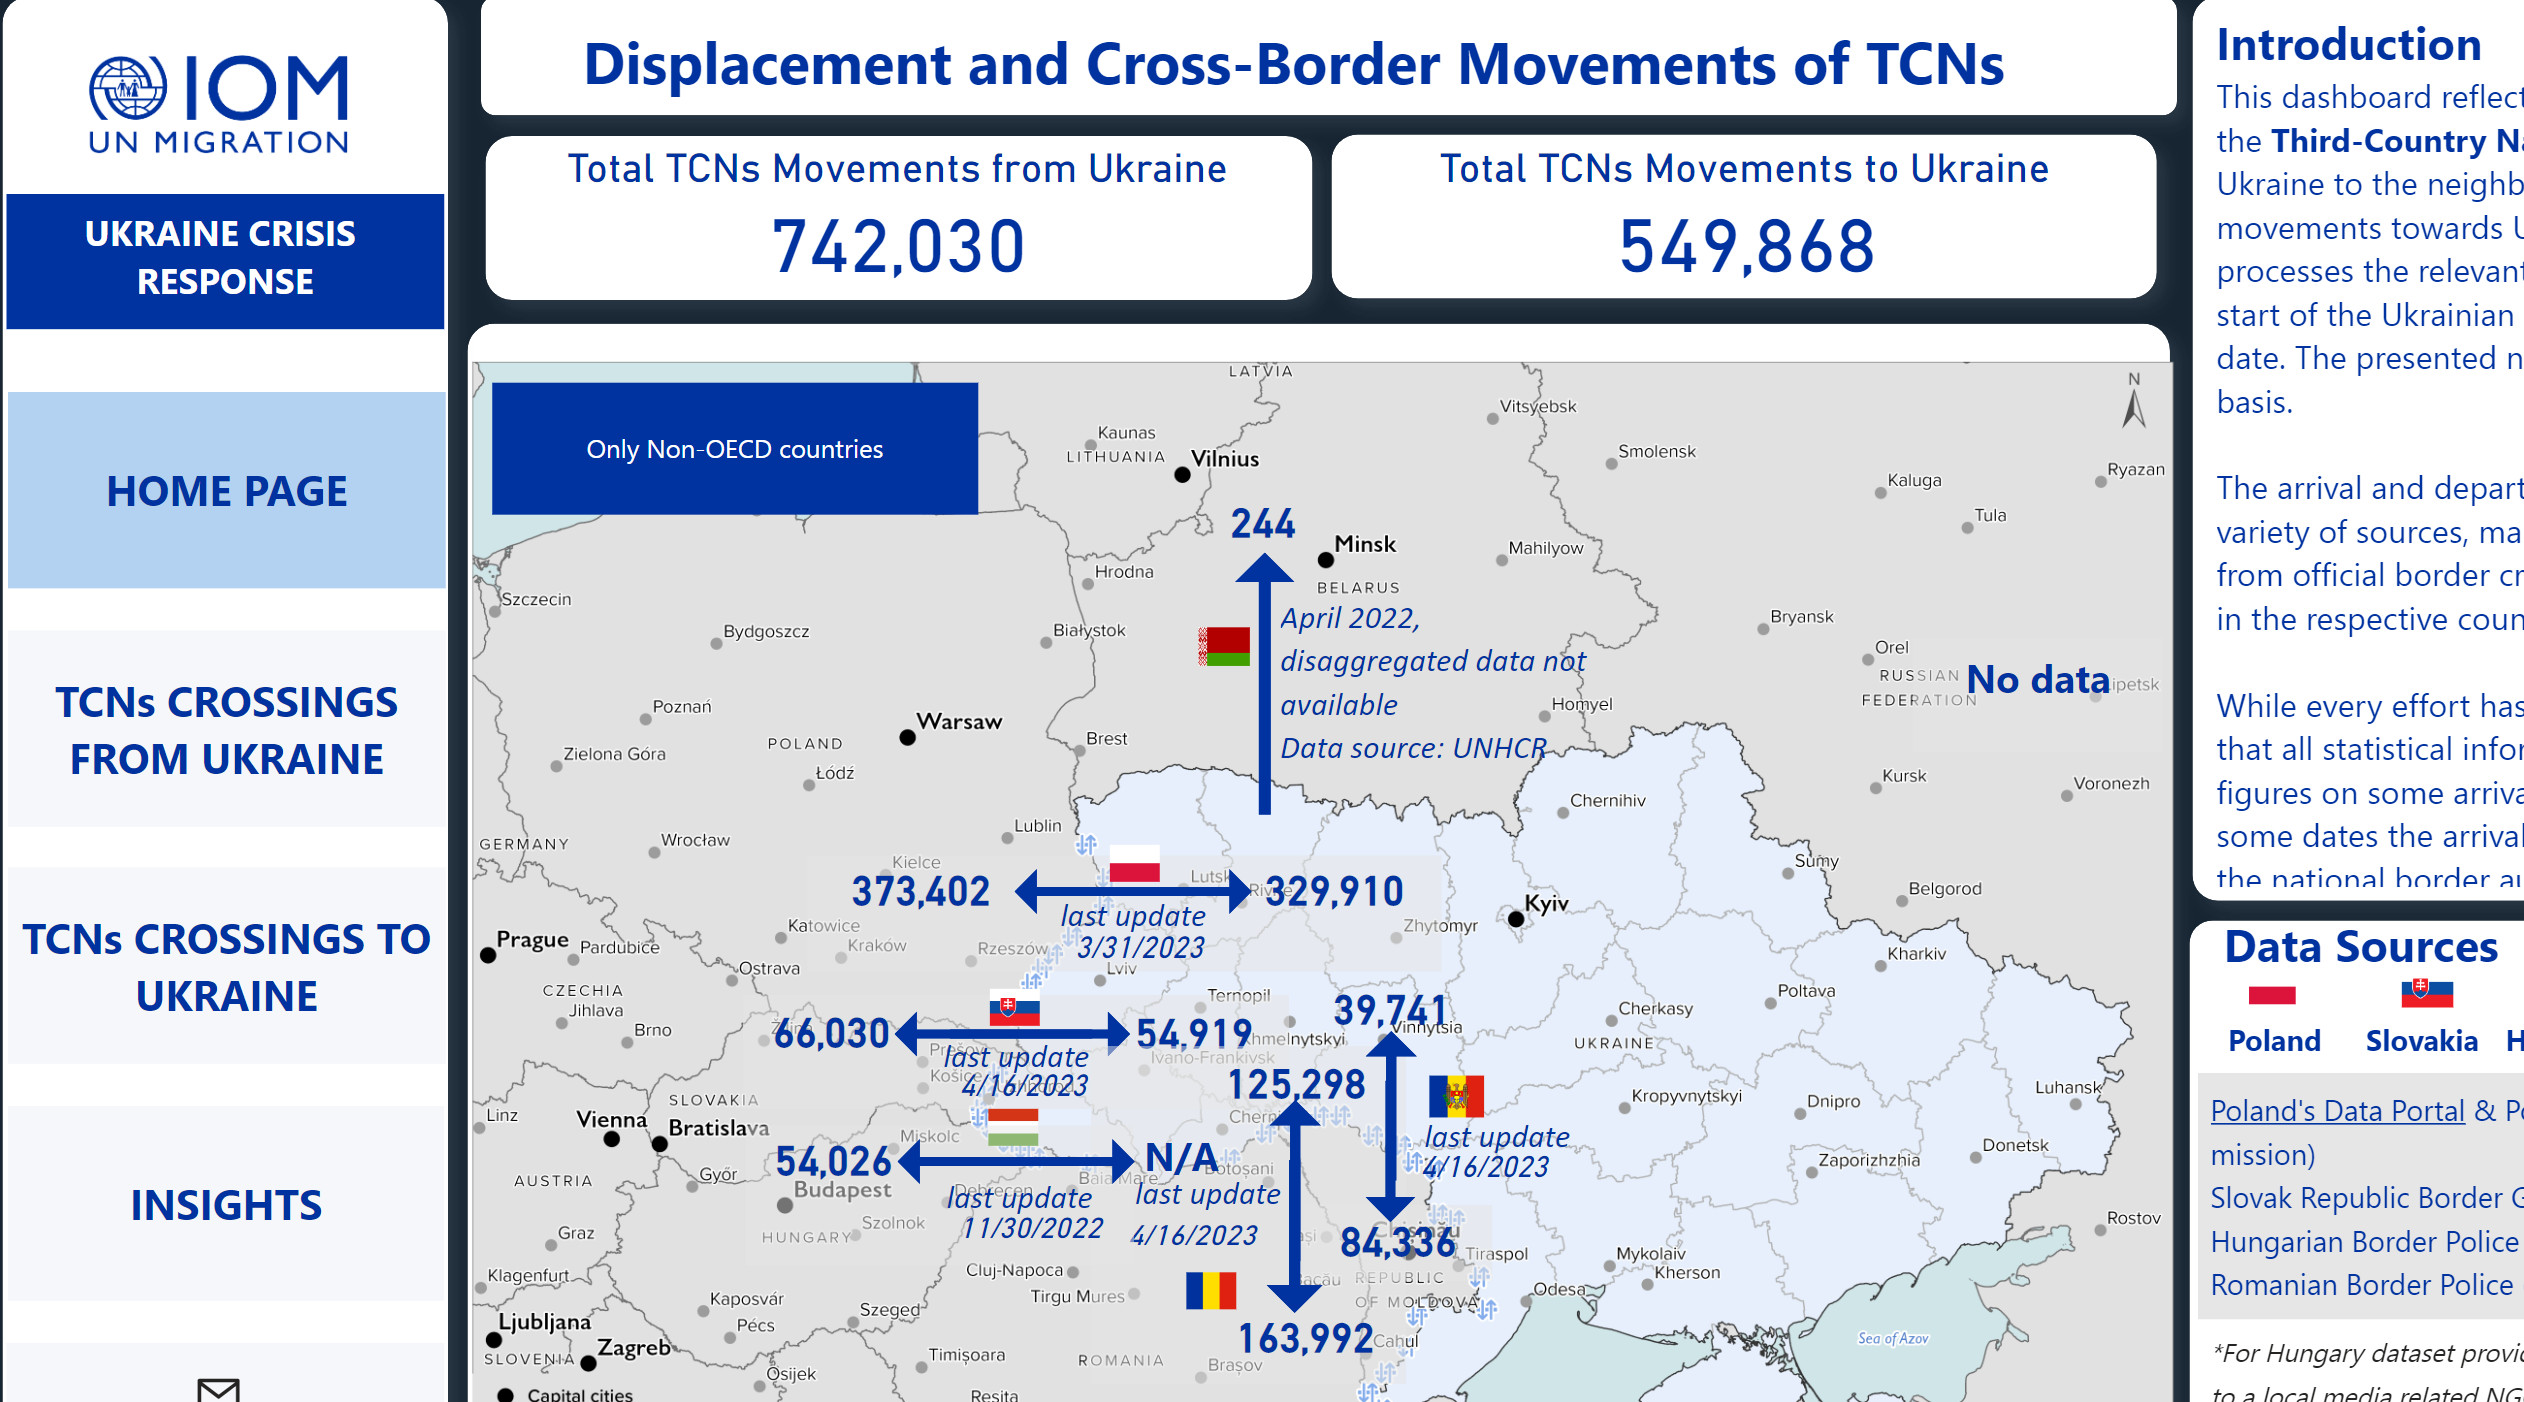
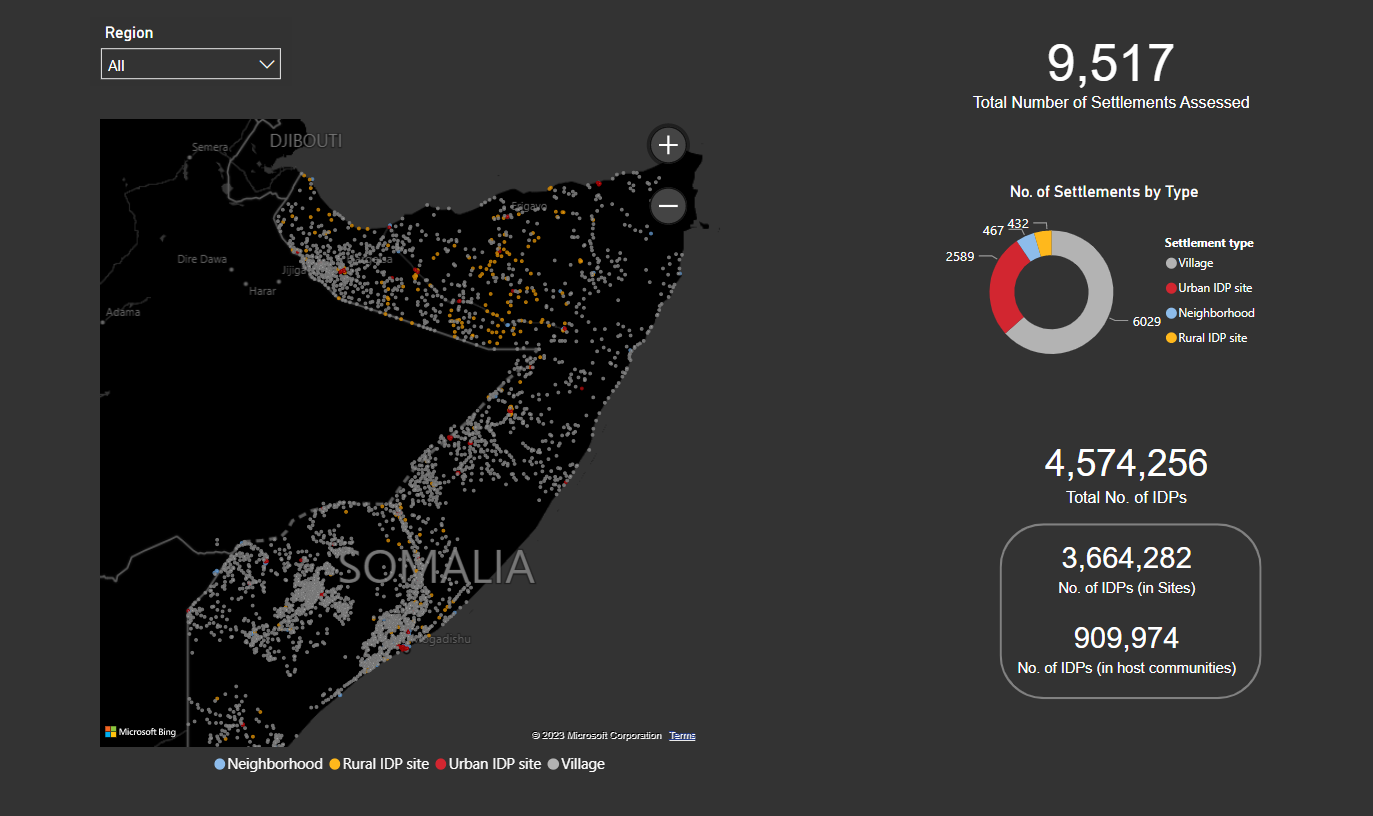
This map shows the geographic coverage of DTM data collection around the world as of Dec 2023
The map used here is for illustration purposes only. Names and boundaries do not imply official endorsement or acceptance by IOM.
Jan 18 2023
Print